Make no mistake about it; this week’s Fed meeting is the primary focal point for market participants. And from my seat, the outcome and/or the “tone” of Jay Powell’s press conference is likely to become the driver of the next near-term trend in both the stock and bond markets.
While I could spend my pixels this morning prognosticating about what I think the Fed is going to do, long-time readers know that is simply not my style. No, I prefer to focus on staying in tune with what markets “are” doing at all times. However, I can say that markets are expecting we will see another 25 basis point hike for the Fed Funds rate tomorrow afternoon.
From there though, the opinions differ. The bulls contend that Powell will tell us that, in the committee’s opinion, rates are now sufficiently restrictive so as to squelch inflation over time. As such, those seeing the market’s glass as at least half full contend that the Fed will push the pause button tomorrow.
On the other side of the court, our furry friends in the bear camp contend that inflation remains elevated/sticky and that since the FOMC has been adamant they will remain “data dependent,” there will be no pause pronouncement made on Wednesday.
Looking at a chart of the S&P 500, it is clear that the bulls have held enough sway lately to push the venerable blue chip index to the very tippy top of the trading range that has been in place since the beginning of February. But unfortunately, our heroes in horns have not been able to push the ball over the goal line.
Thus, it would appear that the stock market is sitting at a critical technical juncture. If Powell talks nice at his presser, I would not be surprised to see buyers emerge. But… And you knew this was coming… Should the Fed Chair decide to take a hawkish tone to the press, well, the bears just might regain possession of the ball for a while. And take the major indices on a ride to the lower reaches of the range in the process.
So, from my perch, while traders continue to digest the daily deluge of earnings, it will be the Fed that determines which way stocks go from here.
While we wait, I thought it might be a good idea to check in on the state of the current trend relative to what the 2023 Cycle Composite predicted to this point.
If you will recall, the Cycle Composite is the brainchild of Ned Davis Research Group. The good folks at NDR take all the 1-year seasonal, 4-year Presidential, and 10-year decennial cycles from 1900 and throw them into a computer. The resulting mashup provides a prediction of what history says stocks ought to do for the coming year.
As I’ve mentioned a time or twenty over the years, the Cycle Composite can, at times, be scary good at predicting the general trend of the stock market. And yet, as should be expected with such endeavors, there are other times when the prediction is not useful at all.
For me, the key is to try and identify if the Cycle Composite’s predictions are “on” (as in, in sync with the market) or not. I’ve found that if the market is largely following the script for the year, then it can be a very helpful tool for looking ahead.
To be sure, I would never use the prediction of historical cycles alone to drive investing decisions. However, knowing what may lie ahead can be helpful at the margins.
So, without further ado, let’s take a look at this year’s chart of the Cycle Composite.
The blue line is the Cycle Composite’s predicted path for the stock market and the dashed orange line is the movement of the S&P 500 itself.
NDR Cycle Composite 2023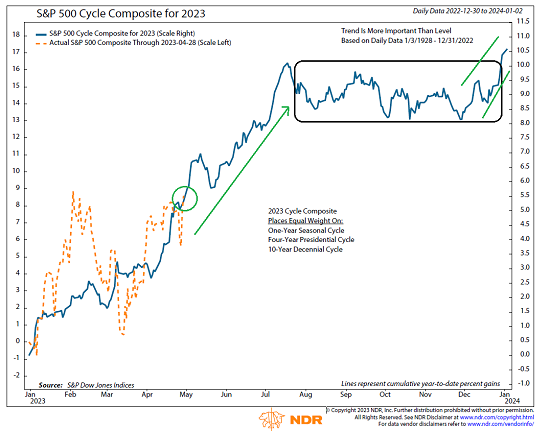
View Chart Online
Image Source: Ned Davis Research Group
Given that the market closed Friday nearly spot on the Cycle Composite’s prediction, I’m going to say that the market is currently in sync with its historical cycles. Yes, that’s right, despite all the stuff going on with inflation, the Fed, and bank failures, the market is almost exactly where history suggested it would be here. Interesting, right?
What’s next, you ask? Well, from here, the Composite suggests that this will NOT be a year to “Sell in May and go away.” No, just the opposite. History suggests that stocks will rally into the middle of July. From there, it appears that a consolidation phase will take hold before the traditional year-end rally takes hold.
Do I expect things to play out exactly as planned here? Absolutely not. But I continue to find this type of analysis fascinating. And while we wait on Mr. Powell, I thought I’d share.
Next, let’s review the “state of the market” through the lens of our market models…
Below is a group of big-picture market models, each of which is designed to identify the state of the primary cycle of the stock market.

* Source: Ned Davis Research (NDR) as of the date of publication. Historical returns are hypothetical average annual performances calculated by NDR.
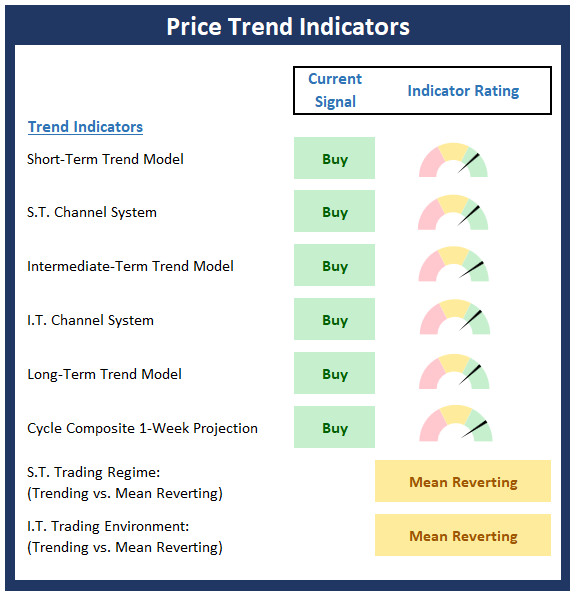
Below are the ratings of key price trend indicators. This board of indicators is designed to tell us about the overall technical health of the market’s trend.
Below is a summary of key internal momentum indicators, which help determine if there is any “oomph” behind a move in the market.
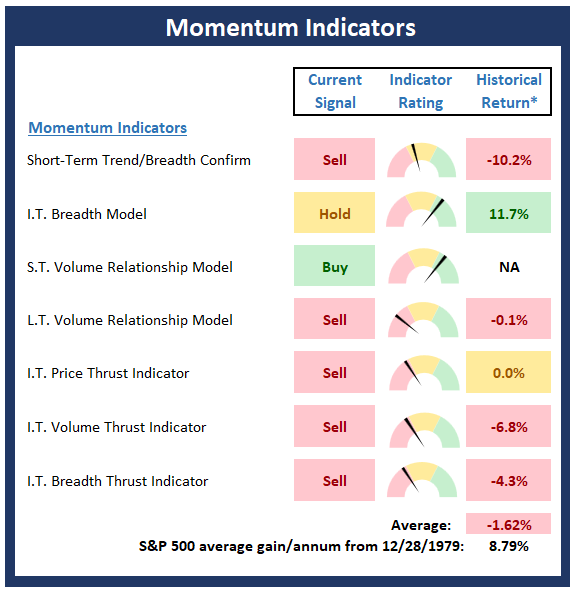
* Source: Ned Davis Research (NDR) as of the date of publication. Historical returns are hypothetical average annual performances calculated by NDR.
Below is a summary of key early warning indicators, which are designed to suggest when the market may be ripe for a reversal on a short-term basis.
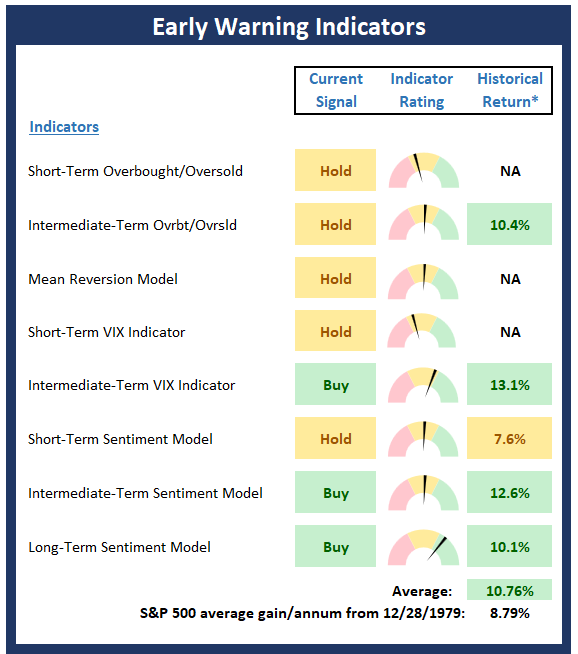
* Source: Ned Davis Research (NDR) as of the date of publication. Historical returns are hypothetical average annual performances calculated by NDR.
Below is a summary of key external factors that have been known to drive stock prices on a long-term basis.
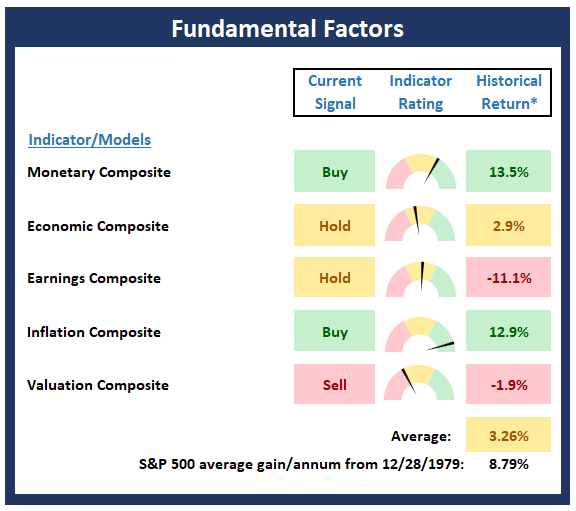
* Source: Ned Davis Research (NDR) as of the date of publication. Historical returns are hypothetical average annual performances calculated by NDR.
Thought for the Day:
He who truly knows has no reason to shout. – Leonardo da Vinci
All the best,
David D. Moenning
Investment Strategist

Disclosures
At the time of publication, Mr. Moenning held long positions in the following securities mentioned: None- Note that positions may change at any time.
NOT INVESTMENT ADVICE. The opinions and forecasts expressed herein are those of Mr. David Moenning and Redwood Wealth and may not actually come to pass. The opinions and viewpoints regarding the future of the markets should not be construed as investment recommendations. The analysis and information in this report is for informational purposes only. No part of the material presented in this report is intended as an investment recommendation or investment advice. Neither the information nor any opinion expressed constitutes a solicitation to purchase or sell securities or any investment program.
Any investment decisions must in all cases be made by the reader or by his or her investment adviser. Do NOT ever purchase any security without doing sufficient research. There is no guarantee that the investment objectives outlined will actually come to pass. All opinions expressed herein are subject to change without notice. Neither the editor, employees, nor any of their affiliates shall have any liability for any loss sustained by anyone who has relied on the information provided.
Mr. Moenning and Redwood Wealth may at times have positions in the securities referred to and may make purchases or sales of these securities while publications are in circulation. Positions may change at any time.
The analysis provided is based on both technical and fundamental research and is provided “as is” without warranty of any kind, either expressed or implied. Although the information contained is derived from sources which are believed to be reliable, they cannot be guaranteed.
Investments in equities carry an inherent element of risk including the potential for significant loss of principal. Past performance is not an indication of future results.