Executive Summary:
After the best return for the month of August since 1984 (+7.0% for S&P 500 index and +7.19% with dividends reinvested) it appears that the trend is indeed an investors best friend here. And while it’s been a little bumpy, the venerable chip index sports a gain of +8.3% year-to-date. However, it is important to remember that you need to have exposure to megacap tech in this market to be smiling at month-end. Lest we forget, the Russell 2000 small cap index (using IWM as a proxy) is still down -5.6% on the year and the midcaps (MDY) are off -5.8%. The reason for the divergence between the S&P and the small and midcaps is simple and by now quite obvious: the companies that are growing in the COVID world are being bought while the rest are not. And the bottom line is this trend is likely to continue until investors can get a handle on when to expect a vaccine to be widely available.
The State of the Trend Indicators
The Trend board scores a perfect 10.0 once again this week as all the models/indicators are both on buy signals and rated positively. So, as I’ve been saying, from a weight-of-the-evidence standpoint, the message from the board remains pretty darn positive.
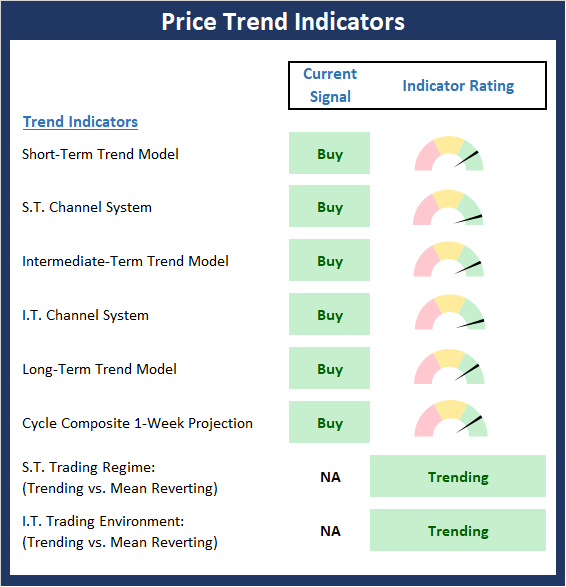
View Trend Indicator Board Online
NOT INDIVIDUAL INVESTMENT ADVICE.
About The Trend Board Indicators: The models/indicators on the Trend Board are designed to determine the overall technical health of the current stock market trend in terms of the short- and intermediate-term time frames.
To review, my take on the state of the market trend is that due to the COVID world we now live in, the universe of companies that can “grow” earnings is much smaller than normal. In addition, those companies growing in this environment are doing so even more strongly than normal. Next, it is important to recognize that the pool of capital looking to invest in “market leadership” is larger than ever. As such, the concentration in the COVID Winners, while continuing to be extraordinary, makes sense in this “new normal” world.
My Take on the State of the Charts…
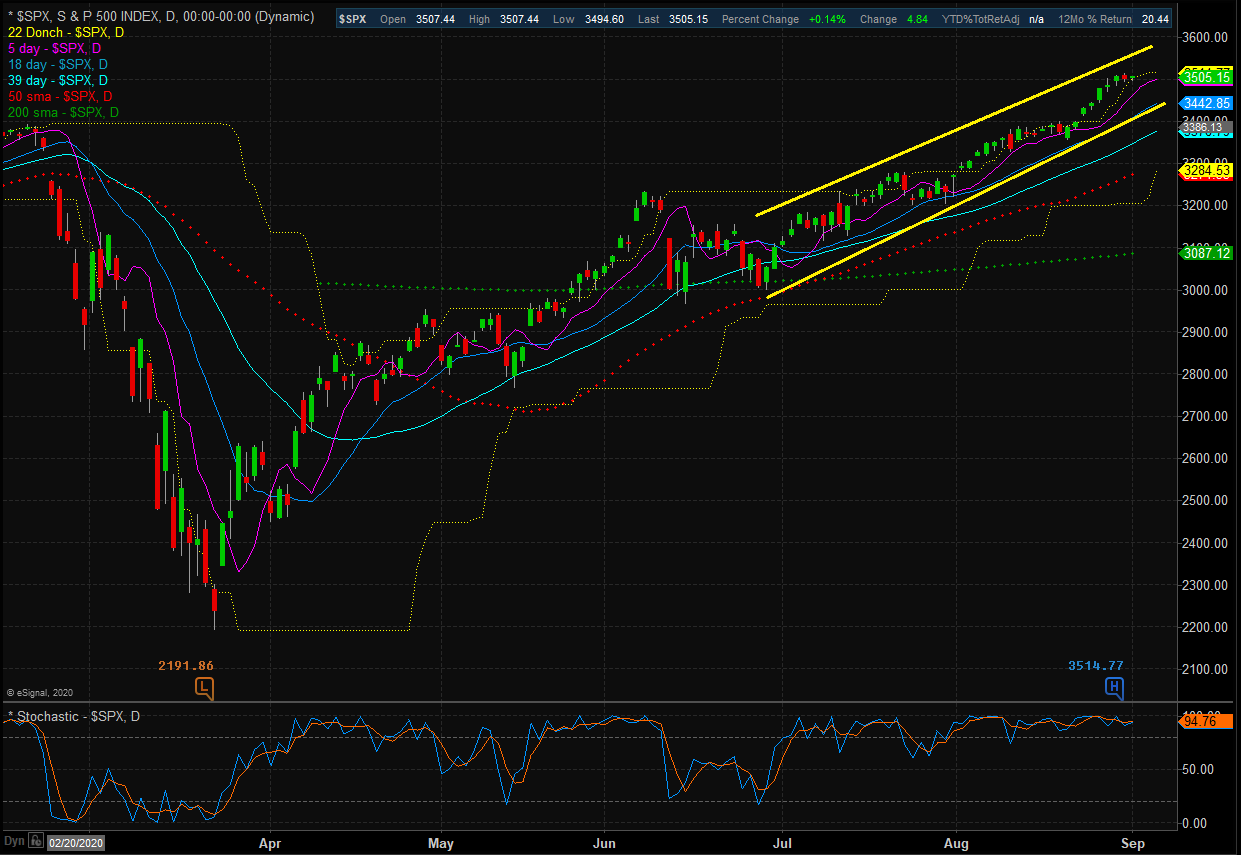
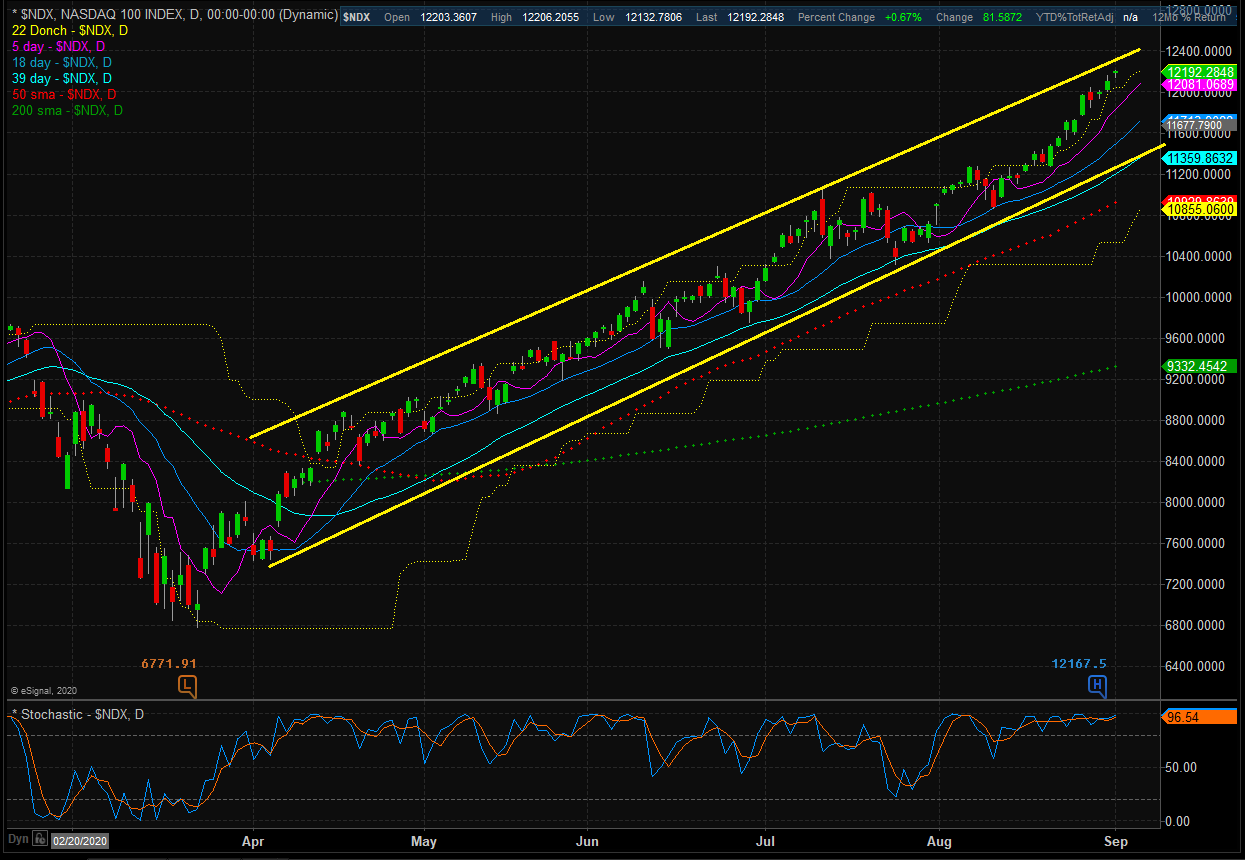
Once again, this remains a tale of two markets. There are those companies that can produce growth, which are represented well in the S&P 500 index and dominate the NASDAQ 100, and those that can’t – which tend to make up a large swath of the small- and midcap indices. So, if you own the SPY or QQQ, you are loving life right now. But if you have concentrations in the smallcap, midcap, value, and developed foreign countries, well, not so much.
S&P 500 – Daily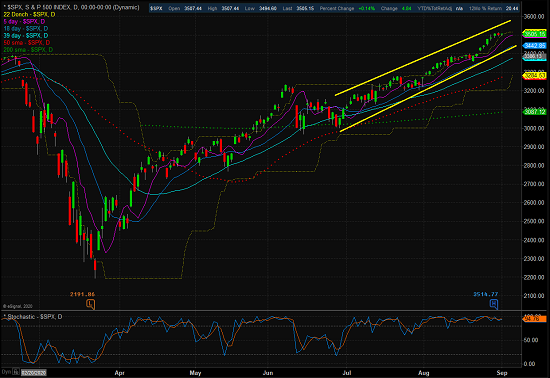
View Larger Chart
NASDAQ 100 – Daily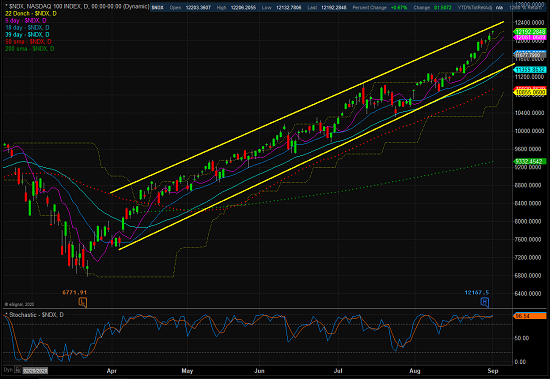
View Larger Chart Online
As the chart below makes clear, the song does not remain the same when one gets away from megacap growth names. In short, anything that requires real economic improvement (as in pre-COVID levels) looks to be moving largely sideways at the present time.
iShares Russell 2000 ETF (IWM) – Daily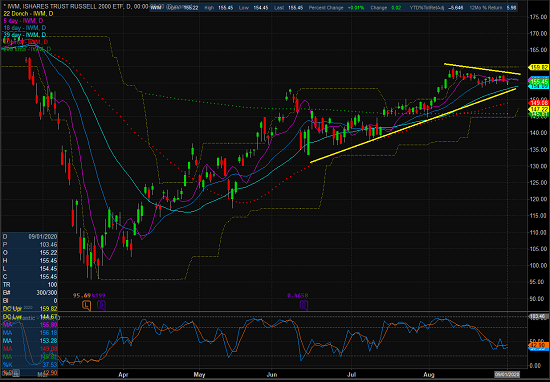
View Larger Chart Online
Next, let’s check in on the state of the market’s internal momentum indicators.
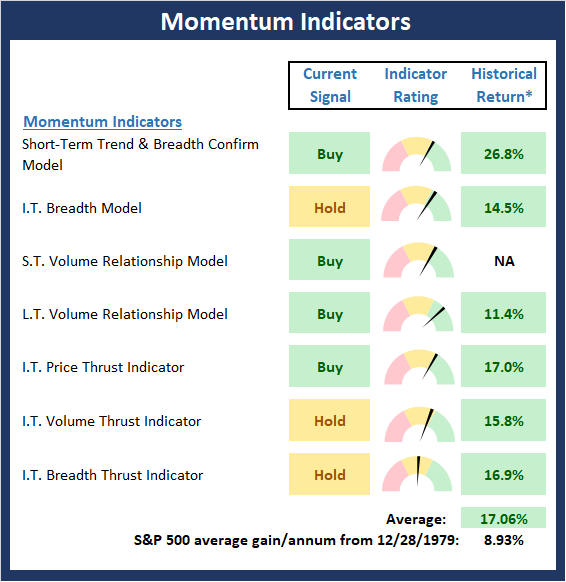
View Momentum Indicator Board Online
* Source: Ned Davis Research (NDR) as of the date of publication. Historical returns are hypothetical average annual performances calculated by NDR. Past performances do not guarantee future results or profitability – NOT INDIVIDUAL INVESTMENT ADVICE.
There is one change to note on the Momentum board as the Intermediate-Term Breadth Thrust indicator moved from negative to neutral. While the board is far from perfect, I believe it is worth recognizing that the divergences seen in some of the trend and momentum indicators are a result of the COVID environment. As such, I don’t view them as negatively as I would under more “normal” circumstances.
Thought For The Day:
We cannot become what we need to be by remaining what we are. -Max De Pree
All the best,
David D. Moenning
Investment Strategist

Disclosures
At the time of publication, Mr. Moenning held long positions in the following securities mentioned: IWM, SPY, QQQ – Note that positions may change at any time.
Trend Models Explained
Short-Term Trend Model: A series of indicator designed to identify the status of the stock market’s short-term (0-3 weeks) trend. The model compares the current price of S&P 500 relative to 5-day customized smoothing (weighted and moved forward 3 periods), the relationship of the 5-day to the 10-day, and the relationship of 10-day to 39-day.
Short- and Intermediate-Term Channel Breakout Systems: The short-term and intermediate-term Channel Breakout Systems are modified versions of the Donchian Channel indicator. According to Wikipedia, “The Donchian channel is an indicator used in market trading developed by Richard Donchian. It is formed by taking the highest high and the lowest low of the last n periods. The area between the high and the low is the channel for the period chosen.”
Intermediate-Term Trend Model: A model designed to identify the status of the stock market’s intermediate-term (3 weeks to 6 months) price trend. The model compares the current weekly price of S&P 500 relative to relative to customized 10-week smoothing (weighted and moved forward 3 periods), the relationship of the 10-week to the 30-week, and the relationship of 30-week to 55-week.
Long-Term Trend Model: An indicator designed to identify the status of the stock market’s longer-term (>6 months) trend. The indicator compares the 50-day smoothing of the S&P 500 relative to its 200-day smoothing. When the 50-day is above 200-day, the indicator is positive and vice versa.
Cycle Composite Projections: The cycle composite combines the 1-year Seasonal, 4-year Presidential, and 10-year Decennial cycles. The indicator reading shown uses the cycle projection for the upcoming week.
Short- and Intermediate-Term Trading Mode Models: These indicator attempt to identify whether the current market action represents a “trending” or “mean reverting” environment. The indicator utilizes the readings of the Efficiency Ratio, the Average Correlation Coefficient, and Trend Strength models.
Momentum Models Explained
Short-Term Trend-and-Breadth Model: History shows the most reliable market moves tend to occur when the breadth indices are in tune with the major market averages. When the breadth measures diverge, investors should take note that a trend reversal may be at hand. This indicator incorporates an All-Cap Dollar Weighted Equity Series and A/D Line. At the time of this writing, when the A/D line has been above its 5-day smoothing and the All-Cap Equal Weighted Equity Series is above its 25-day smoothing, the equity index has gained at a rate of +26.5% per year since 1980. When one of the indicators is above its smoothing, the equity index has gained at a rate of +14.5% per year. And when both are below, the equity index has lost over -20% per year.
Intermediate-Term Breadth Model: A proprietary diffusion index developed by Ned Davis Research. The indicator is designed to determine the technical health of the market’s 157 sub-industry groups (GICS categorizes the market into 11 sectors, 20 industries, and 157 sub-industry groups). Technical health is determined by the direction of each sub-industry’s long-term smoothing and the rate of change of the sub-industry’s price index.
Short- and Long-Term Volume Relationship Models: These models review the relationship between “supply” and “demand” volume over the short- and intermediate-term time frames.
Intermediate-Term Price Thrust Model: This indicator measures the 3-day rate of change of the Value Line Composite relative to the standard deviation of the 30-day average.
Intermediate-Term Volume Thrust Model: This indicator uses NASDAQ volume data to indicate bullish and bearish conditions for the NASDAQ Composite Index. The indicator plots the ratio of the 10-day total of NASDAQ daily advancing volume to the 10-day total of daily declining volume. The indicator supports the case that a rising market supported by heavier volume in the advancing issues tends to be the most bullish condition, while a declining market with downside volume dominating confirms bearish conditions.
Breadth Thrust Model: This indicator uses the number of NASDAQ-listed stocks advancing and declining to indicate bullish or bearish breadth conditions for the NASDAQ Composite. The indicator plots the ratio of the 10-day total of the number of stocks rising on the NASDAQ each day to the 10-day total of the number of stocks declining each day. Using 10-day totals smooths the random daily fluctuations and gives indications on an intermediate-term basis. Historically, the NASDAQ Composite has performed much better when the 10-day A/D ratio is high (strong breadth) and worse when the indicator is in its lower mode (weak breadth). The most bullish conditions for the NASDAQ when the 10-day A/D indicator is not only high, but has recently posted an extreme high reading and thus indicated a thrust of upside momentum. Bearish conditions are confirmed when the indicator is low and has recently signaled a downside breadth thrust.
NOT INVESTMENT ADVICE. The opinions and forecasts expressed herein are those of Mr. David Moenning and Redwood Wealth and may not actually come to pass. The opinions and viewpoints regarding the future of the markets should not be construed as investment recommendations. The analysis and information in this report is for informational purposes only. No part of the material presented in this report is intended as an investment recommendation or investment advice. Neither the information nor any opinion expressed constitutes a solicitation to purchase or sell securities or any investment program.
Any investment decisions must in all cases be made by the reader or by his or her investment adviser. Do NOT ever purchase any security without doing sufficient research. There is no guarantee that the investment objectives outlined will actually come to pass. All opinions expressed herein are subject to change without notice. Neither the editor, employees, nor any of their affiliates shall have any liability for any loss sustained by anyone who has relied on the information provided.
Mr. Moenning and Redwood Wealth may at times have positions in the securities referred to and may make purchases or sales of these securities while publications are in circulation. Positions may change at any time.
The analysis provided is based on both technical and fundamental research and is provided “as is” without warranty of any kind, either expressed or implied. Although the information contained is derived from sources which are believed to be reliable, they cannot be guaranteed.
Investments in equities carry an inherent element of risk including the potential for significant loss of principal. Past performance is not an indication of future results.