Executive Summary:
Stocks find themselves in a negative state again this morning as the headlines are all bad. There are new fears about an economic shutdown in the UK, concerns about the startling rise in new COVID cases, the global banking scandal, and worries about additional stimulus here at home due to the political repercussions of RBG’s death. Oh, and then there is the matter of the calendar as historically this is one of the weakest weeks of the year and September/October periods are often messy – especially in election years. Taken together, it means there may be some additional downside testing to be done. However, the good news is that all of my favorite, longer-term, big-picture market models remain positive. As such, I’ll continue to view the current environment as a corrective/consolidation phase.
The Big-Picture Market Models
There are no changes to the Primary Cycle board this week. And with the board currently sporting an awful lot of green, my take on the selling in the market is that we’re seeing a correction of the excesses that had built up over the summer. So for now, I’ll continue to give the bulls the benefit of doubt and begin looking to put some of the dry powder I have to work.
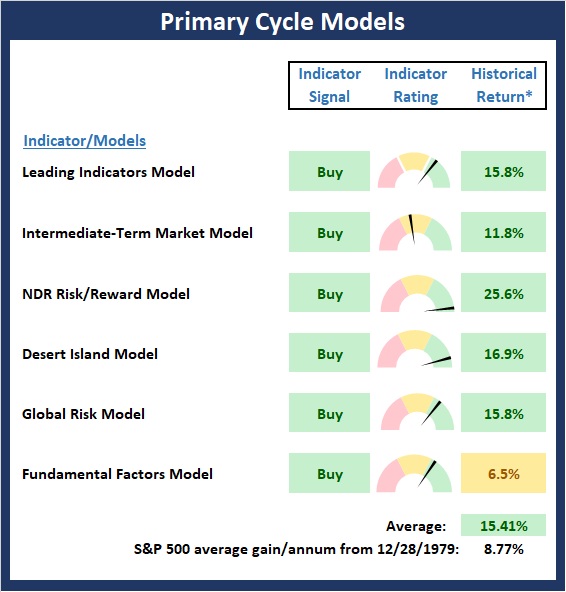
View the Primary Cycle Model Board Online
* Source: Ned Davis Research (NDR) as of the date of publication. Historical returns are hypothetical average annual performances calculated by NDR. Past performances do not guarantee future results or profitability – NOT INDIVIDUAL INVESTMENT ADVICE.
Checking In On The “Primary” Cycles
While I don’t often make portfolio adjustments based on the long-term trends in the stock market (aka the “primary cycles”), I have found over the years that checking in on state of the cycles and the weekly/monthly charts helps to keep the big-picture in perspective.
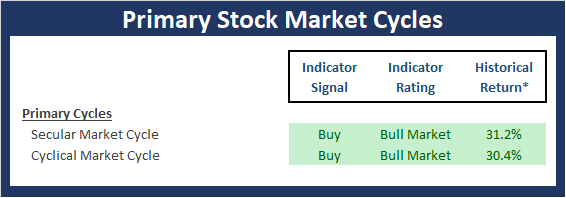
View the Primary Cycles Board Online
* Source: Ned Davis Research (NDR) as of the date of publication. Historical returns are hypothetical average annual performances calculated by NDR. Past performances do not guarantee future results or profitability – NOT INDIVIDUAL INVESTMENT ADVICE.
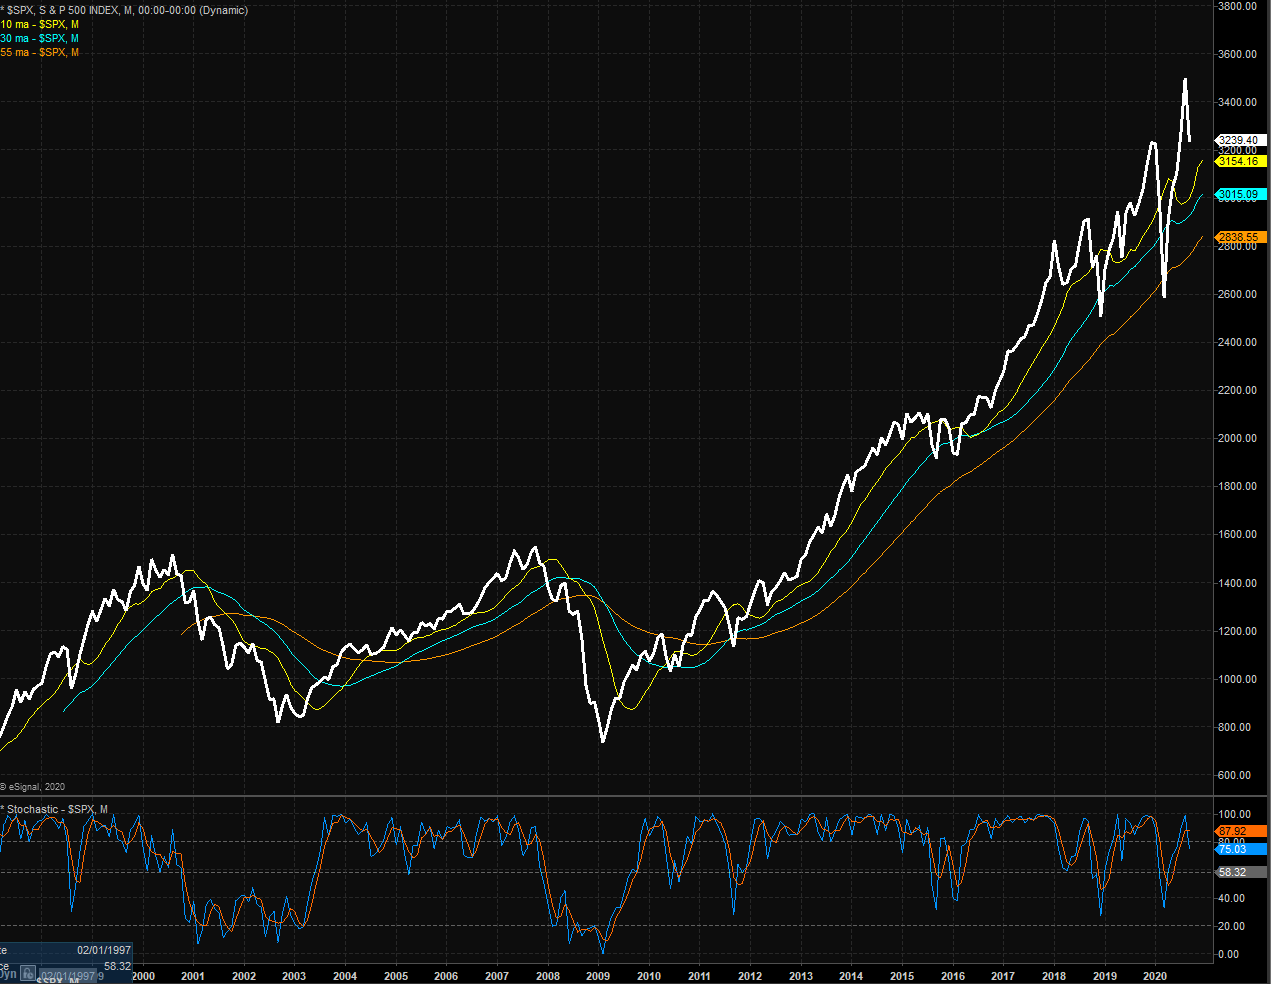
The Secular Market Cycle
Definition: A secular bull market is a period in which stock prices rise at an above-average rate for an extended period (think 5 years or longer) and suffer only relatively short intervening declines. A secular bear market is an extended period of flat or declining stock prices. Secular bull or bear markets typically consist of multiple cyclical bull and bear markets. Below is a monthly chart of the S&P 500 Index illustrating the current cycle, which we estimate began on March 9, 2009.
S&P 500 – Monthly
View Larger Chart Online
The Cyclical Market Cycle
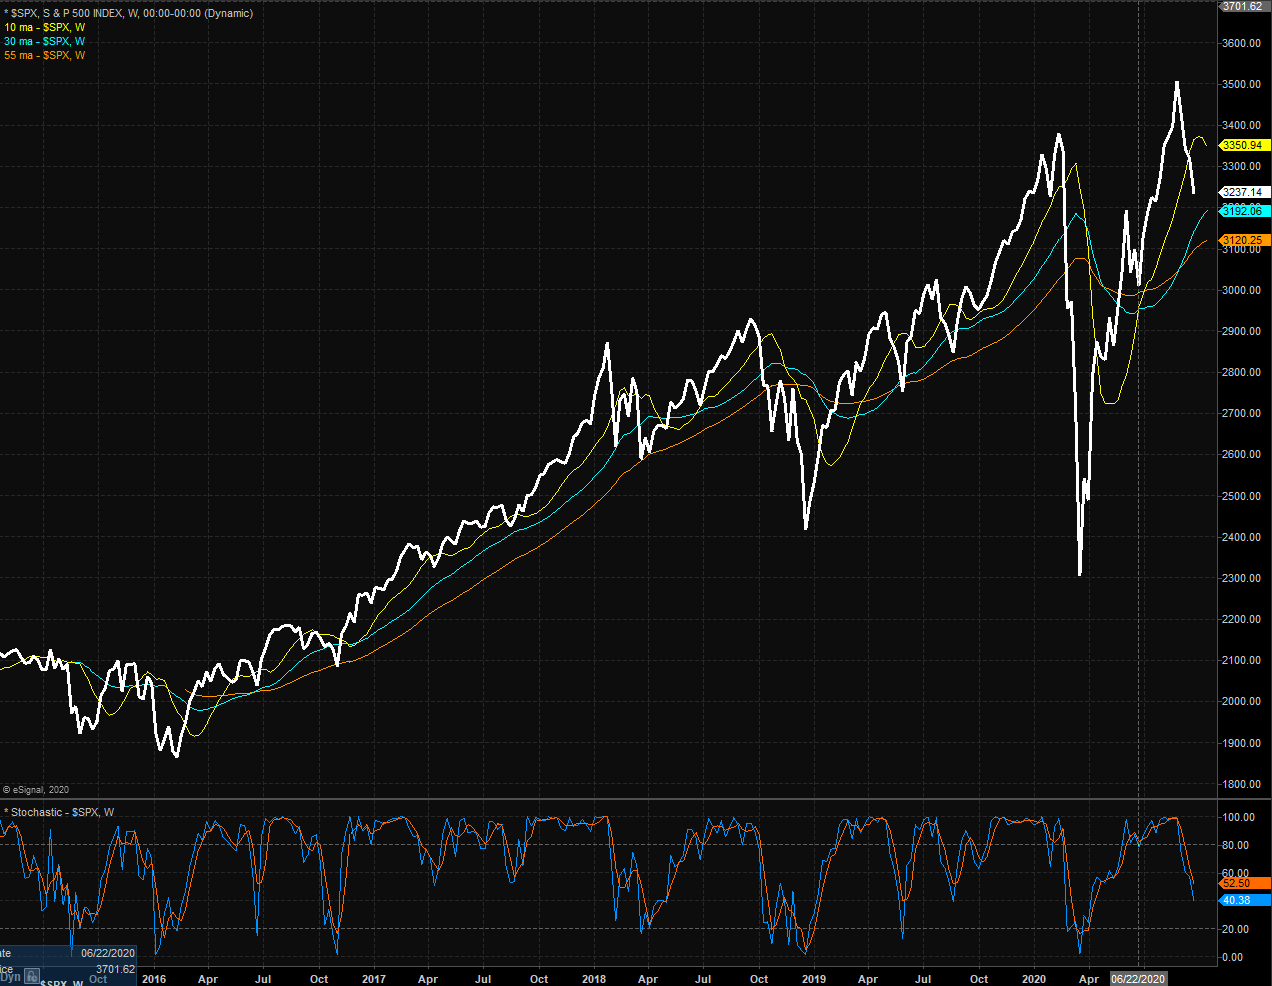
Definition: A cyclical bull market requires a 30% rise in the DJIA after 50 calendar days or a 13% rise after 155 calendar days. Reversals of 30% in the Value Line Geometric Index since 1965 also qualify. A cyclical bear market requires a 30% drop in the DJIA after 50 calendar days or a 13% decline after 145 calendar days. Reversals of 30% in the Value Line Geometric Index also qualify. Below is a weekly chart of the S&P 500 illustrating the current cycle, which we estimate began on March 24, 2020.
S&P 500 – Weekly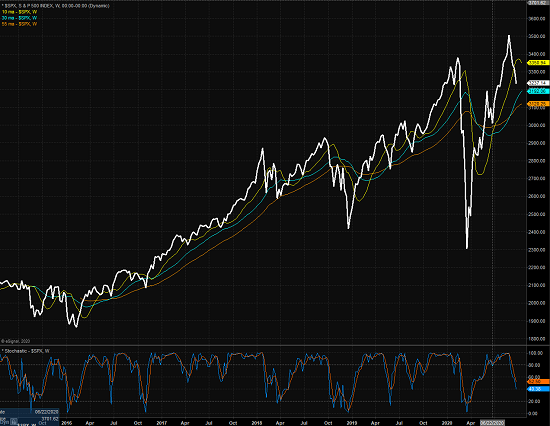
View Larger Chart Online
Thought For The Day:
The world is but a canvas to the imagination. -Henry David Thoreau
All the best,
David D. Moenning
Investment Strategist

Disclosures
At the time of publication, Mr. Moenning held long positions in the following securities mentioned: None – Note that positions may change at any time.
Primary Market Models Explained
Leading Indicators Model: A group of indicators that have historically shown tendencies to lead the market at major turning points.
Intermediate-Term Market Model: A composite model-of-models focused on trend and momentum indicators which has been designed to provide identify intermediate-term trading opportunities. The model includes 38 independent indicators covering price trends, volume, breadth, momentum, historical cycles, sentiment, and mean reversion.
Risk/Reward Model: A model-of-models designed to provide an overall view of the state of the risk/reward environment. The model includes tape, monetary, and sentiment indicators as well as 7 big-picture market model readings.
Desert Island Model: If I was stranded on a desert island with access to only one market model to manage money with, this would be the model. The model is a comprehensive model-of-models comprised of trend, momentum, mean reversion, economic, monetary, sentiment, and factor-based indicators/models.
Global Risk Model: A series of indicators designed to gauge the relative risk tolerance of the global investment environment.
Fundamental Factors Model: A model-of-models designed to provide a reading on the “macro state” of the environment. The model is comprised of indicators/models in the areas of monetary conditions, the economy, corporate earnings, inflation, and stock market valuation.
NOT INVESTMENT ADVICE. The opinions and forecasts expressed herein are those of Mr. David Moenning and Redwood Wealth and may not actually come to pass. The opinions and viewpoints regarding the future of the markets should not be construed as investment recommendations. The analysis and information in this report is for informational purposes only. No part of the material presented in this report is intended as an investment recommendation or investment advice. Neither the information nor any opinion expressed constitutes a solicitation to purchase or sell securities or any investment program.
Any investment decisions must in all cases be made by the reader or by his or her investment adviser. Do NOT ever purchase any security without doing sufficient research. There is no guarantee that the investment objectives outlined will actually come to pass. All opinions expressed herein are subject to change without notice. Neither the editor, employees, nor any of their affiliates shall have any liability for any loss sustained by anyone who has relied on the information provided.
Mr. Moenning and Redwood Wealth may at times have positions in the securities referred to and may make purchases or sales of these securities while publications are in circulation. Positions may change at any time.
The analysis provided is based on both technical and fundamental research and is provided “as is” without warranty of any kind, either expressed or implied. Although the information contained is derived from sources which are believed to be reliable, they cannot be guaranteed.
Investments in equities carry an inherent element of risk including the potential for significant loss of principal. Past performance is not an indication of future results.