Executive Summary:
From my seat, the key to the action on the chart of the S&P 500 here is the battle for the 50-day moving average. To review, the bulls were able to make a stop at the 3225 zone on a closing basis. This was important because it kept the pullback from reaching the key -10% zone (the low point of the decline was -9.3%). From there, our heroes in horns got some help from the news flow as renewed stimulus talks gave the market hope that the additional support – support the Fed says the economy needs badly – was back on the table. So, with a stop being made, the next step for traders was to buy the dip and/or cover shorts. As such, it would appear that a trading range is developing. And with the 50-day seen by many as the key line in the sand determining which team has possession of the ball, my take is that there is a battle currently taking place – directly on the 50-day. So, if the bulls can push decidedly above 3355, my bet is the next resistance zone and perhaps even the top of the range is on the table. But if our furry friends in the bear camp prevail here, then a retest of the correction lows could be on the table. As such, I’ll be watching the near-term action closely here.
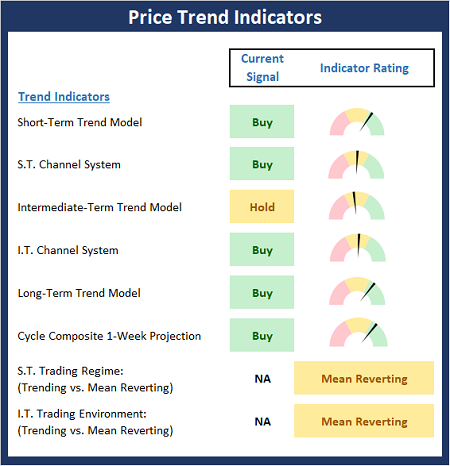
The State of the Trend Indicators
As the saying goes, what a difference a day makes. Or in this case a week. Last week, the Trend Board was in trouble with only one buy signal on the board. This week, all of the models are green, save one. Granted, the readings of the component models are less than robust. But the bottom line is the models perked up enough to move from red to green. So, for now at least, the Trend board suggests the advantage goes to the bulls. Fingers crossed.
NOT INDIVIDUAL INVESTMENT ADVICE.
About The Trend Board Indicators: The models/indicators on the Trend Board are designed to determine the overall technical health of the current stock market trend in terms of the short- and intermediate-term time frames.
My Take on the State of the Charts…
I largely summarized the state of the chart action in my executive summary above. In short, it looks to me as if the bulls and bears are duking it out over the S&P’s 50-day moving average and the winner will likely run with the ball for a while. If the bulls can break through, the next resistance zone is around 3420ish. And if the bears take control, the low of the recent decline would represent the next battleground. For now, I don’t think either team has a distinct advantage, so the winner of this little tussle will likely control the next move.
S&P 500 – Daily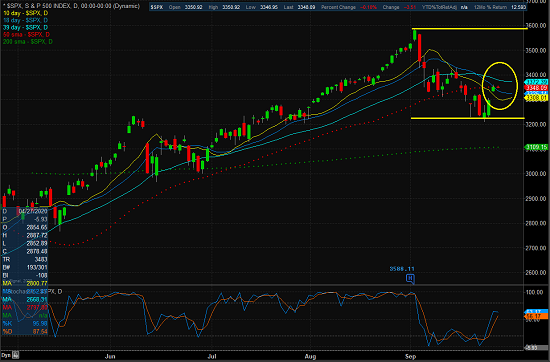
View Larger Chart
Next, let’s check in on the state of the market’s internal momentum indicators.
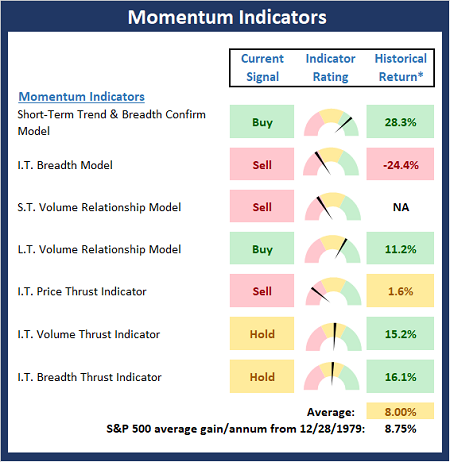
* Source: Ned Davis Research (NDR) as of the date of publication. Historical returns are hypothetical average annual performances calculated by NDR. Past performances do not guarantee future results or profitability – NOT INDIVIDUAL INVESTMENT ADVICE.
I mentioned above that I didn’t think either team had a real edge here. Exhibit A for my argument is the state of the Momentum board. If the bulls had really turned things around and were ready to make a run, I would expect to see a lot more green here. The good news is that there are now 2 buy signals on the board – up from 1 last week. The bad news is there are only 2 buy signals on the board. The bottom line is I’d like to see some additional improvement in the momentum indicators before I can declare the corrective phase over. For now, the bulls have the ball. But they need to put a drive together because a “3 and out” here could easily return the momentum to the bear sideline.
Thought For The Day:
For a man to conquer himself is the first and noblest of all victories -Plato
All the best,
David D. Moenning
Investment Strategist

Disclosures
At the time of publication, Mr. Moenning held long positions in the following securities mentioned: None – Note that positions may change at any time.
Trend Models Explained
Short-Term Trend Model: A series of indicator designed to identify the status of the stock market’s short-term (0-3 weeks) trend. The model compares the current price of S&P 500 relative to 5-day customized smoothing (weighted and moved forward 3 periods), the relationship of the 5-day to the 10-day, and the relationship of 10-day to 39-day.
Short- and Intermediate-Term Channel Breakout Systems: The short-term and intermediate-term Channel Breakout Systems are modified versions of the Donchian Channel indicator. According to Wikipedia, “The Donchian channel is an indicator used in market trading developed by Richard Donchian. It is formed by taking the highest high and the lowest low of the last n periods. The area between the high and the low is the channel for the period chosen.”
Intermediate-Term Trend Model: A model designed to identify the status of the stock market’s intermediate-term (3 weeks to 6 months) price trend. The model compares the current weekly price of S&P 500 relative to relative to customized 10-week smoothing (weighted and moved forward 3 periods), the relationship of the 10-week to the 30-week, and the relationship of 30-week to 55-week.
Long-Term Trend Model: An indicator designed to identify the status of the stock market’s longer-term (>6 months) trend. The indicator compares the 50-day smoothing of the S&P 500 relative to its 200-day smoothing. When the 50-day is above 200-day, the indicator is positive and vice versa.
Cycle Composite Projections: The cycle composite combines the 1-year Seasonal, 4-year Presidential, and 10-year Decennial cycles. The indicator reading shown uses the cycle projection for the upcoming week.
Short- and Intermediate-Term Trading Mode Models: These indicators attempt to identify whether the current market action represents a “trending” or “mean reverting” environment. The indicator utilizes the readings of the Efficiency Ratio, the Average Correlation Coefficient, and Trend Strength models.
Momentum Models Explained
Short-Term Trend-and-Breadth Model: History shows the most reliable market moves tend to occur when the breadth indices are in tune with the major market averages. When the breadth measures diverge, investors should take note that a trend reversal may be at hand. This indicator incorporates an All-Cap Dollar Weighted Equity Series and A/D Line. At the time of this writing, when the A/D line has been above its 5-day smoothing and the All-Cap Equal Weighted Equity Series is above its 25-day smoothing, the equity index has gained at a rate of +26.5% per year since 1980. When one of the indicators is above its smoothing, the equity index has gained at a rate of +14.5% per year. And when both are below, the equity index has lost over -20% per year.
Intermediate-Term Breadth Model: A proprietary diffusion index developed by Ned Davis Research. The indicator is designed to determine the technical health of the market’s 157 sub-industry groups (GICS categorizes the market into 11 sectors, 20 industries, and 157 sub-industry groups). Technical health is determined by the direction of each sub-industry’s long-term smoothing and the rate of change of the sub-industry’s price index.
Short- and Long-Term Volume Relationship Models: These models review the relationship between “supply” and “demand” volume over the short- and intermediate-term time frames.
Intermediate-Term Price Thrust Model: This indicator measures the 3-day rate of change of the Value Line Composite relative to the standard deviation of the 30-day average.
Intermediate-Term Volume Thrust Model: This indicator uses NASDAQ volume data to indicate bullish and bearish conditions for the NASDAQ Composite Index. The indicator plots the ratio of the 10-day total of NASDAQ daily advancing volume to the 10-day total of daily declining volume. The indicator supports the case that a rising market supported by heavier volume in the advancing issues tends to be the most bullish condition, while a declining market with downside volume dominating confirms bearish conditions.
Breadth Thrust Model: This indicator uses the number of NASDAQ-listed stocks advancing and declining to indicate bullish or bearish breadth conditions for the NASDAQ Composite. The indicator plots the ratio of the 10-day total of the number of stocks rising on the NASDAQ each day to the 10-day total of the number of stocks declining each day. Using 10-day totals smooths the random daily fluctuations and gives indications on an intermediate-term basis. Historically, the NASDAQ Composite has performed much better when the 10-day A/D ratio is high (strong breadth) and worse when the indicator is in its lower mode (weak breadth). The most bullish conditions for the NASDAQ when the 10-day A/D indicator is not only high, but has recently posted an extreme high reading and thus indicated a thrust of upside momentum. Bearish conditions are confirmed when the indicator is low and has recently signaled a downside breadth thrust.
NOT INVESTMENT ADVICE. The opinions and forecasts expressed herein are those of Mr. David Moenning and Redwood Wealth and may not actually come to pass. The opinions and viewpoints regarding the future of the markets should not be construed as investment recommendations. The analysis and information in this report is for informational purposes only. No part of the material presented in this report is intended as an investment recommendation or investment advice. Neither the information nor any opinion expressed constitutes a solicitation to purchase or sell securities or any investment program.
Any investment decisions must in all cases be made by the reader or by his or her investment adviser. Do NOT ever purchase any security without doing sufficient research. There is no guarantee that the investment objectives outlined will actually come to pass. All opinions expressed herein are subject to change without notice. Neither the editor, employees, nor any of their affiliates shall have any liability for any loss sustained by anyone who has relied on the information provided.
Mr. Moenning and Redwood Wealth may at times have positions in the securities referred to and may make purchases or sales of these securities while publications are in circulation. Positions may change at any time.
The analysis provided is based on both technical and fundamental research and is provided “as is” without warranty of any kind, either expressed or implied. Although the information contained is derived from sources which are believed to be reliable, they cannot be guaranteed.
Investments in equities carry an inherent element of risk including the potential for significant loss of principal. Past performance is not an indication of future results.