Good morning and Happy Columbus Day. While banks and the bond market have the good sense to take the day off, stock markets are open, and traders appear to be busy processing the latest headlines.
In case you haven’t heard, it sounds like the White House may have jumped the gun with their enthusiasm over a trade deal on Friday. As such, futures were initially lower this morning. However, as of mid-morning, the Dow, S&P and NASDAQ indices all sport positive returns on the day.
My quick take here is that while even a “Phase One” deal isn’t done and the December tariffs are still in play, investors may be assuming/discounting the idea that a deal that is “good enough” will get done down the road. And in turn, the U.S. and the global economies won’t get wrecked by the lack of a deal or the onset of an “economic cold war.”
Thus, the stock market, which tends to look ahead 6-9 months, may be focusing on the positive. Well, for now, anyway.
But since it’s the start of a new week, it’s time to put aside my subjective view of the action and to review the “state” of our favorite market models.
Have a great week!
Weekly Market Model Review
Each week we do a disciplined, deep dive into our key market indicators and models. The overall goal of this exercise is to (a) remove emotion from the investment process, (b) stay “in tune” with the primary market cycles, and (c) remain cognizant of the risk/reward environment.
The Major Market Models
We start with six of our favorite long-term market models. These models are designed to help determine the “state” of the overall market. Put another way, these models indicate which team is in control of the primary trend.
There is one modest change to the Primary Cycle board this week, although you have to look closely to find it. Cutting to the chase, the historical return of our Fundamental Factors model slipped. However, the model itself remains on a buy so the song remains the same from a big-picture standpoint here.
This week’s mean percentage score of my 6 favorite models slipped again to 71.4% from 74.7% last week while the median pulled back to 72.5% from 77.5%.

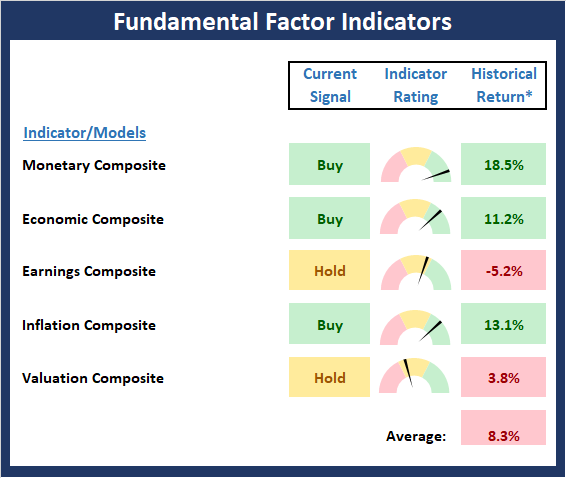
The State of the Fundamental Backdrop
Next, we review the market’s fundamental factors in the areas of interest rates, the economy, inflation, and valuations.
The big change to the Fundamental Factor board this week was the decline in our Earnings composite. However, this has more to do with the fact that we have expanded the model composite that any change to the indicators. The composite is now comprised of two different EPS models. One model charts the rate of change of reported earnings. The second model focuses on the drivers of earnings and includes indicators such as U.S. industrial production, the CRB Spot Raw Industrial Material Price Index, the Treasury yield curve, Institute for Supply Management (ISM) indices, corporate bond credit spreads, unemployment claims, and the trend in analyst earnings estimate revisions for the S&P 500. This week, the model we “drivers” model, went negative. And history shows that stocks have done poorly when the model score would have been negative. In addition, one of the models in the Monetary composite fell last week, pushing our composite into the neutral zone. As such, I will have to say that one of the key pillars of the fundamental case took a hit.
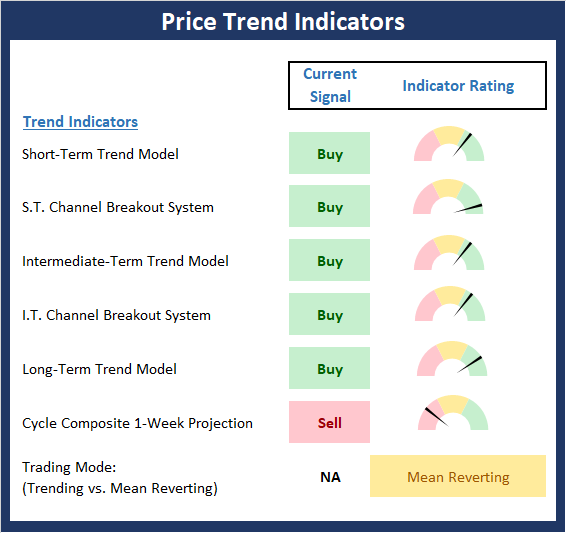
The State of the Trend
Next, we review the state of the current trend. This board of indicators is designed to tell us about the overall health of the current market trends.
The key to the short-term price action remains the news flow. Friday was another day of what appeared to be “big news,” which created another gap on the charts to fill in the future. However, as we all know by now, the headline was overexuberant and prices have settled back a bit. And speaking of overexuberance, I feel like all the green on the Price board may be just that. While many of the indicators are technical positive, there is considerable resistance overhead and there is a distinct lack of confirmation among the major indices. Thus, I think we have to take the current “state” of the price board with a grain of salt.
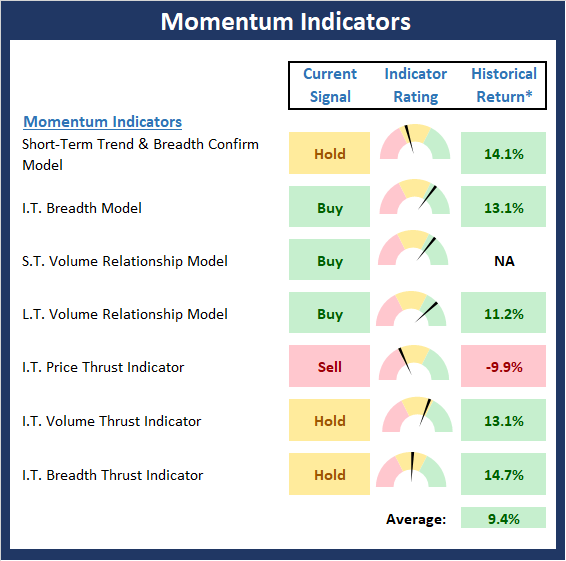
The State of Internal Momentum
Next, we analyze the “oomph” behind the current trend via our group of market momentum indicators/models.
The Momentum board remains a mixed bag and in my humble opinion, is a better indication of the “state of the market” than the price indicators. I would need to see significant improvement here in order to move to a more optimistic stance. For now, I’ll continue to give the bulls the benefit of the doubt but keep the champagne in the fridge.
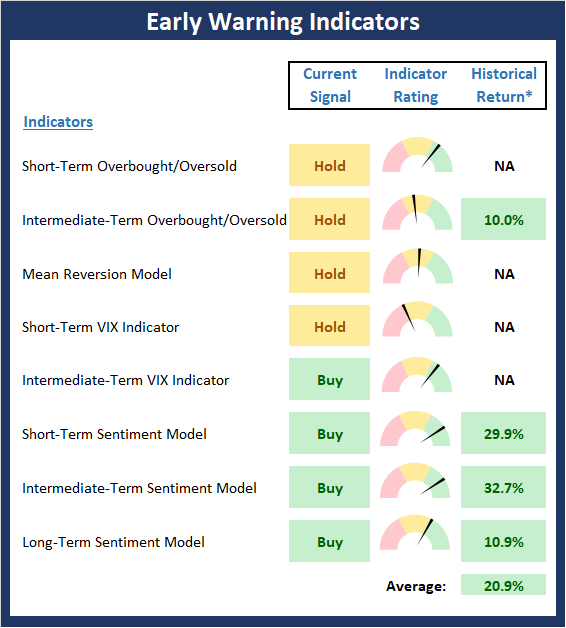
Early Warning Signals
Once we have identified the current environment, the state of the trend, and the degree of momentum behind the move, we review the potential for a counter-trend move to begin. This batch of indicators is designed to suggest when the table is set for the trend to “go the other way.”
My take on the message from Early Warning board is that the stars are not aligned in one direction or the other at this time. And while there is a fair amount of green on the board, the VIX and overbought/sold oscillators are getting close to turning red and sentiment indicators are moving the wrong direction for the bulls. Thus, I think the current readings of this board aren’t as upbeat as a quick glance might suggest.
If your actions inspire others to dream more, learn more, do more and become more, you are a leader – John Quincy Adams
All the best,
David D. Moenning
Investment Strategist

Disclosures
At the time of publication, Mr. Moenning and/or Redwood Wealth Management, LLC held long positions in the following securities mentioned: None
Note that positions may change at any time.
NOT INVESTMENT ADVICE. The opinions and forecasts expressed herein are those of Mr. David Moenning and Redwood Wealth and may not actually come to pass. The opinions and viewpoints regarding the future of the markets should not be construed as investment recommendations. The analysis and information in this report is for informational purposes only. No part of the material presented in this report is intended as an investment recommendation or investment advice. Neither the information nor any opinion expressed constitutes a solicitation to purchase or sell securities or any investment program.
Any investment decisions must in all cases be made by the reader or by his or her investment adviser. Do NOT ever purchase any security without doing sufficient research. There is no guarantee that the investment objectives outlined will actually come to pass. All opinions expressed herein are subject to change without notice. Neither the editor, employees, nor any of their affiliates shall have any liability for any loss sustained by anyone who has relied on the information provided.
Mr. Moenning and Redwood Wealth may at times have positions in the securities referred to and may make purchases or sales of these securities while publications are in circulation. Positions may change at any time.
The analysis provided is based on both technical and fundamental research and is provided “as is” without warranty of any kind, either expressed or implied. Although the information contained is derived from sources which are believed to be reliable, they cannot be guaranteed.
Investments in equities carry an inherent element of risk including the potential for significant loss of principal. Past performance is not an indication of future results.