The current market is being driven by the headlines. More specifically, the stock market is moving to and fro based on any/all headlines about the state of Putin’s unprovoked, unconscionable, indefensible, and completely inhumane invasion of Ukraine.
Yet, as we discussed last week, there is more going on underneath the surface here than just Putin’s quest to rewrite history and return Russia to its perceived former greatness. As in inflation looking higher for longer. And the Fed looking more and more behind the curve. And tightening financial conditions. And last but not least, slowing growth.
As such, investors of all shapes and sizes can’t be blamed for feeling a bit squeamish these days. Uncertainty is high on many fronts as commodity prices surge, rates rise, and according to the folks at StreetAccount, the path of least resistance for the stock market looks to be lower.
On that note, the question of the day is, “How much is enough?” How much do stocks need to fall to fully price in the highest inflation since I graduated college? How much more inflation do we need to factor in? How much more can/will oil/energy prices rise due to Putin’s atrocities? And how much will all-of-the-above cause growth – in terms of both GDP and earnings per share – to slow?
At the lowest point, which occurred just 4 trading days ago, the S&P 500 had fallen -13.05% from its January 3, 2022 high water mark. The NASDAQ 100 had declined just about -20% (19.92% to be exact). The Dow was off -11.3%. And the smallcaps continued to take it on the chin, sporting a loss of -20.5%.
So, investors have to decide if these declines are enough to discount (a) the idea of inflation sticking around longer than most had expected, (b) the Fed embarking on what could become an extended hiking cycle, (c) tightening financial conditions, and (d) slowing growth.
To be sure, the only way to know the answers is with a ginormous helping of hindsight. But from my seat, knowing the questions the market is trying to deal with can go a long way towards understanding the action.
My thinking is that Ms. Market views the inflation and growth issues to be the most important. And the questions here are, how high/low will they go? And for how long?
Goldman Sachs (GS) weighed in this week by cutting their 2022 price target on the S&P 500 a couple hundred points (4700 from 4900) and by dropping their forecast for US GDP from 3.1% to 2.9%. And it is worth noting that this was the second cut in their stock market target in as many months.
While a 2.9% growth rate for the economy certainly isn’t too shabby, the key here is to recognize that Goldman’s projection had been as high as 4.2% recently. If my calculator is functioning properly, this means that the firm has reduced their GDP forecast by about 31% – all in response to slower-than-expected economic growth and surging commodity prices.
What really got my attention about David Kostin’s note was this: “Our economists currently assign a roughly 20% – 35% probability of a U.S. recession in the coming year. Under such a scenario, we would invariably have to cut our [earnings] estimate even further.”
Wait, what? Recession? When did anybody start talking about a recession? Isn’t the economy humming along right now?
Yes, the economy is doing just fine, thank you. For now. But remember, the stock market game is about expectations of future activity – not what you’ve done for me lately.
Goldman economist Joseph Briggs put the issue in perspective by writing, “The largest risk to the US economy from the war in Ukraine remains higher commodity prices… Rising commodity prices will likely result in a drag on consumer spending, as households — and lower-income households in particular — are forced to spend a larger share of income on food and gas.”
So there you have it. Understand that the stock market hasn’t been declining due to the toll of human lives being lost in Ukraine, but rather the prospect of economic growth slowing.
Which brings me back to the title of this morning’s missive, “How much is enough?” As in, how much of Ukraine does Putin need to take in order to end the attack? How much will the Russian populous stand for? How much is enough for China to get involved to broker peace? And/or, how much human suffering will occur before the West steps in?
Obviously, we are dealing with a lot of unknowns here. But I believe that if a diplomatic solution can be found or if the war can be resolved quickly, the current decline in stocks is probably getting close to being “enough.” But, if this mess drags on, or escalates to unthinkable levels, it becomes a horse of a different color.
Now let’s review the “state of the market” through the lens of our market models…
The Big-Picture Market Models
We start with six of our favorite long-term market models. These models are designed to help determine the “state” of the overall market.
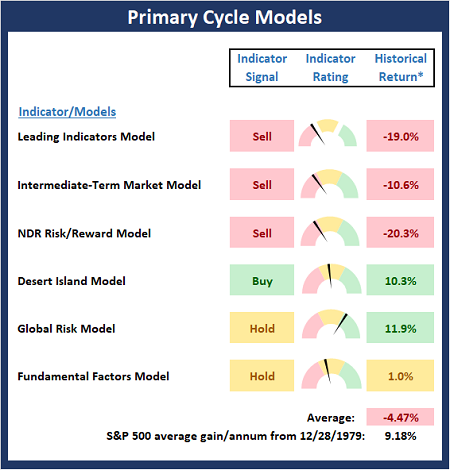
* Source: Ned Davis Research (NDR) as of the date of publication. Historical returns are hypothetical average annual performances calculated by NDR.
The Fundamental Backdrop
Next, we review the market’s fundamental factors including interest rates, the economy, earnings, inflation, and valuations.
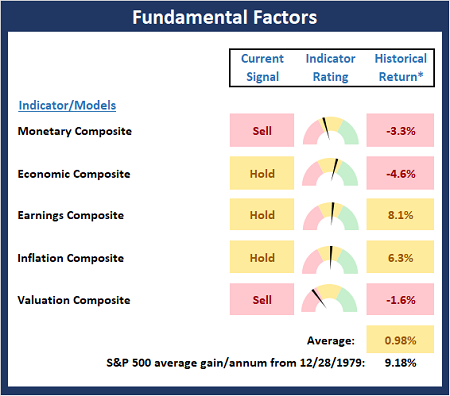
* Source: Ned Davis Research (NDR) as of the date of publication. Historical returns are hypothetical average annual performances calculated by NDR.
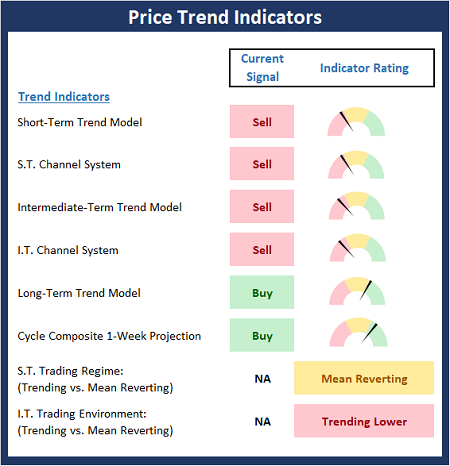
The State of the Trend
After reviewing the big-picture models and the fundamental backdrop, I like to look at the state of the current trend. This board of indicators is designed to tell us about the overall technical health of the market’s trend.
The State of Internal Momentum
Next, we analyze the momentum indicators/models to determine if there is any “oomph” behind the current move.
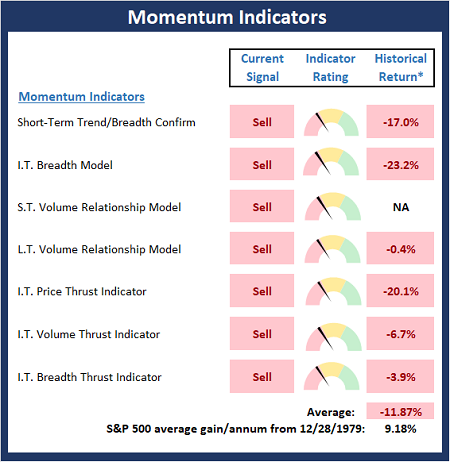
* Source: Ned Davis Research (NDR) as of the date of publication. Historical returns are hypothetical average annual performances calculated by NDR.
Early Warning Indicators
Finally, we look at our early warning indicators to gauge the potential for countertrend moves. This batch of indicators is designed to suggest when the table is set for the trend to “go the other way.”
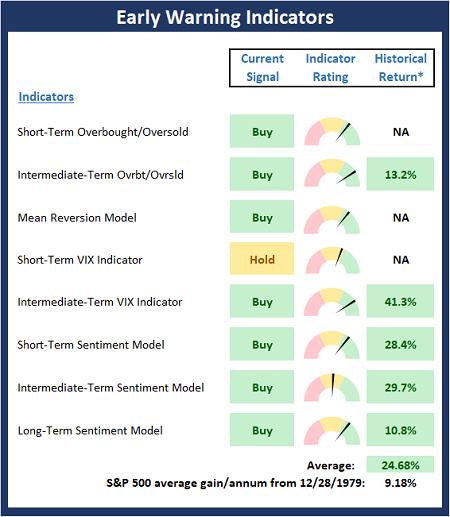
* Source: Ned Davis Research (NDR) as of the date of publication. Historical returns are hypothetical average annual performances calculated by NDR.
Thought for the Day:
“I skate to where the puck is going to be, not where it has been.” — Wayne Gretzky
All the best,
David D. Moenning
Investment Strategist

Disclosures
At the time of publication, Mr. Moenning held long positions in the following securities mentioned: None- Note that positions may change at any time.
NOT INVESTMENT ADVICE. The opinions and forecasts expressed herein are those of Mr. David Moenning and Redwood Wealth and may not actually come to pass. The opinions and viewpoints regarding the future of the markets should not be construed as investment recommendations. The analysis and information in this report is for informational purposes only. No part of the material presented in this report is intended as an investment recommendation or investment advice. Neither the information nor any opinion expressed constitutes a solicitation to purchase or sell securities or any investment program.
Any investment decisions must in all cases be made by the reader or by his or her investment adviser. Do NOT ever purchase any security without doing sufficient research. There is no guarantee that the investment objectives outlined will actually come to pass. All opinions expressed herein are subject to change without notice. Neither the editor, employees, nor any of their affiliates shall have any liability for any loss sustained by anyone who has relied on the information provided.
Mr. Moenning and Redwood Wealth may at times have positions in the securities referred to and may make purchases or sales of these securities while publications are in circulation. Positions may change at any time.
The analysis provided is based on both technical and fundamental research and is provided “as is” without warranty of any kind, either expressed or implied. Although the information contained is derived from sources which are believed to be reliable, they cannot be guaranteed.
Investments in equities carry an inherent element of risk including the potential for significant loss of principal. Past performance is not an indication of future results.