I feel strongly that one of the keys to longevity in the business of investment management is having a repeatable process. I start each week with a review of the state of the big-picture environment. I then review the current trend and the degree of momentum behind the move. Next, I look at the potential for a countertrend move to develop via our Early Warning Indicator Board, which is designed to suggest when “the table might be set” for the trend to “go the other way” for a while.
My current take is the odds for a countertrend move to develop are improving but are not yet at what I’d call “table pounding” levels. And one thing I’ve learned in this game is that the best turning points occur when the “stars are aligned” on the Early Warning Board.

* Source: Ned Davis Research (NDR) as of the date of publication. Historical returns are hypothetical average annual performances calculated by NDR. Past performances do not guarantee future results or profitability – NOT INDIVIDUAL INVESTMENT ADVICE.
View Early Warning Indicator Board Online
I think the key to the current situation is the market appears to be in a “trending” mode, which usually doesn’t favor a “mean reversion” trading approach. For example, the VIX indicators are negative. However, one could easily argue that the VIX is in the process of retreating from extreme levels. As such, these indicators could easily stay red for some time yet.
In addition, I believe we must take the current sentiment readings with a grain of salt. The key here is that the state of the virus and the economy appear to be driving sentiment. And with so much uncertainty remaining in these areas, the positive readings could easily persist longer than normal.
Stochastic Review
Over the years, I have found that reviewing the basic stochastics is a solid way to determine when an index or security may be ripe to “go the other way” for a while. I like to keep it simple here by using a 14 day %K (with 1-day smoothing) and a 3 day %D. It’s not fancy, but it tends to be an effective tool for an oftentimes complex subject.
S&P 500 – Daily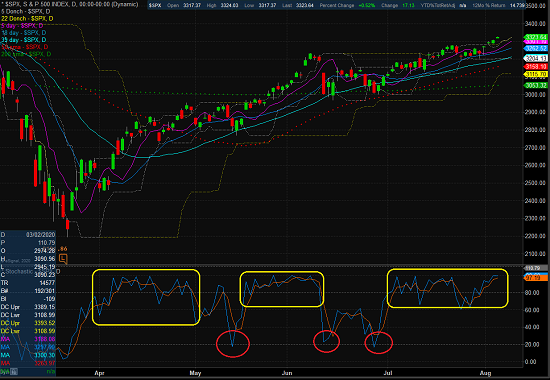
View Larger Chart
In my humble opinion, playing countertrend or mean reversion moves is more art than science. The key point is to recognize that overbought conditions do not always lead to immediate selling. Yes, in time, all overbought conditions are relieved. However, it is the timing of these moves that can be difficult.
It is for this reason that I play the trading game differently during what I call “good overbought” conditions. I’ve learned over the years that when the market becomes entrenched in an uptrend, stocks tend to get overbought and stay overbought for extended periods of time. During such cycles, it generally pays to resist the urge to sell into strength and instead, give the bulls the benefit of any/all doubt.
Therefore, my takeaway from our “early warning” review is consistent with my view of the other indicator boards. My plan is to (1) stay seated on the bull train as long as investors large and small continue to discount better days ahead for both the virus and the economy, (2) stay focused on the leaders, and (3) be prepared for any changes to the virus/economic outlook.
Thought For The Day:
“The way to get ahead is to over-deliver. Expand the organization’s expectations of you and exceed them.” –Jack Welch
All the best,
David D. Moenning
Investment Strategist

Disclosures
At the time of publication, Mr. Moenning held long positions in the following securities mentioned: None – Note that positions may change at any time.
Early Warning Models Explained
Short-Term Overbought/sold Indicator: This indicator is the current reading of the 14,1,3 stochastic oscillator. When the oscillator is above 80 and the %K is above the %D, the indicator gives an overbought reading. Conversely, when the oscillator is below 20 and %K is below its %D, the indicator is oversold.
Intermediate-Term Overbought/sold Indicator: This indicator is a 40-day RSI reading. When above 57.5, the indicator is considered overbought and wnen below 45 it is oversold.
Mean Reversion Model: This is a diffusion model consisting of five indicators that can produce buy and sell signals based on overbought/sold conditions.
VIX Indicator: This indicators looks at the current reading of the VIX relative to a series of Donchian Channel bands. When the indicator reaches an extreme reading in either direction, it is an indication that a market trend could reverse in the near-term.
Short-Term Sentiment Indicator: This is a model-of-models composed of 18 independent sentiment indicators designed to indicate when market sentiment has reached an extreme from a short-term perspective. Historical analysis indicates that the stock market’s best gains come after an environment has become extremely negative from a sentiment standpoint. Conversely, when sentiment becomes extremely positive, market returns have been subpar.
Intermediate-Term Sentiment Indicator: This is a model-of-models composed of 7 independent sentiment indicators designed to indicate when market sentiment has reached an extreme from a intermediate-term perspective. Historical analysis indicates that the stock market’s best gains come after an environment has become extremely negative from a sentiment standpoint. Conversely, when sentiment becomes extremely positive, market returns have been subpar.
Long-Term Sentiment Indicator: This is a model-of-models composed of 6 independent sentiment indicators designed to indicate when market sentiment has reached an extreme from a long-term perspective. Historical analysis indicates that the stock market’s best gains come after an environment has become extremely negative from a sentiment standpoint. Conversely, when sentiment becomes extremely positive, market returns have been subpar.
NOT INVESTMENT ADVICE. The opinions and forecasts expressed herein are those of Mr. David Moenning and Redwood Wealth and may not actually come to pass. The opinions and viewpoints regarding the future of the markets should not be construed as investment recommendations. The analysis and information in this report is for informational purposes only. No part of the material presented in this report is intended as an investment recommendation or investment advice. Neither the information nor any opinion expressed constitutes a solicitation to purchase or sell securities or any investment program.
Any investment decisions must in all cases be made by the reader or by his or her investment adviser. Do NOT ever purchase any security without doing sufficient research. There is no guarantee that the investment objectives outlined will actually come to pass. All opinions expressed herein are subject to change without notice. Neither the editor, employees, nor any of their affiliates shall have any liability for any loss sustained by anyone who has relied on the information provided.
Mr. Moenning and Redwood Wealth may at times have positions in the securities referred to and may make purchases or sales of these securities while publications are in circulation. Positions may change at any time.
The analysis provided is based on both technical and fundamental research and is provided “as is” without warranty of any kind, either expressed or implied. Although the information contained is derived from sources which are believed to be reliable, they cannot be guaranteed.
Investments in equities carry an inherent element of risk including the potential for significant loss of principal. Past performance is not an indication of future results.